Blog · Drive
California's Speed Camera Trial Logged 100,000 Violations From Just 4 Devices in 10 Days
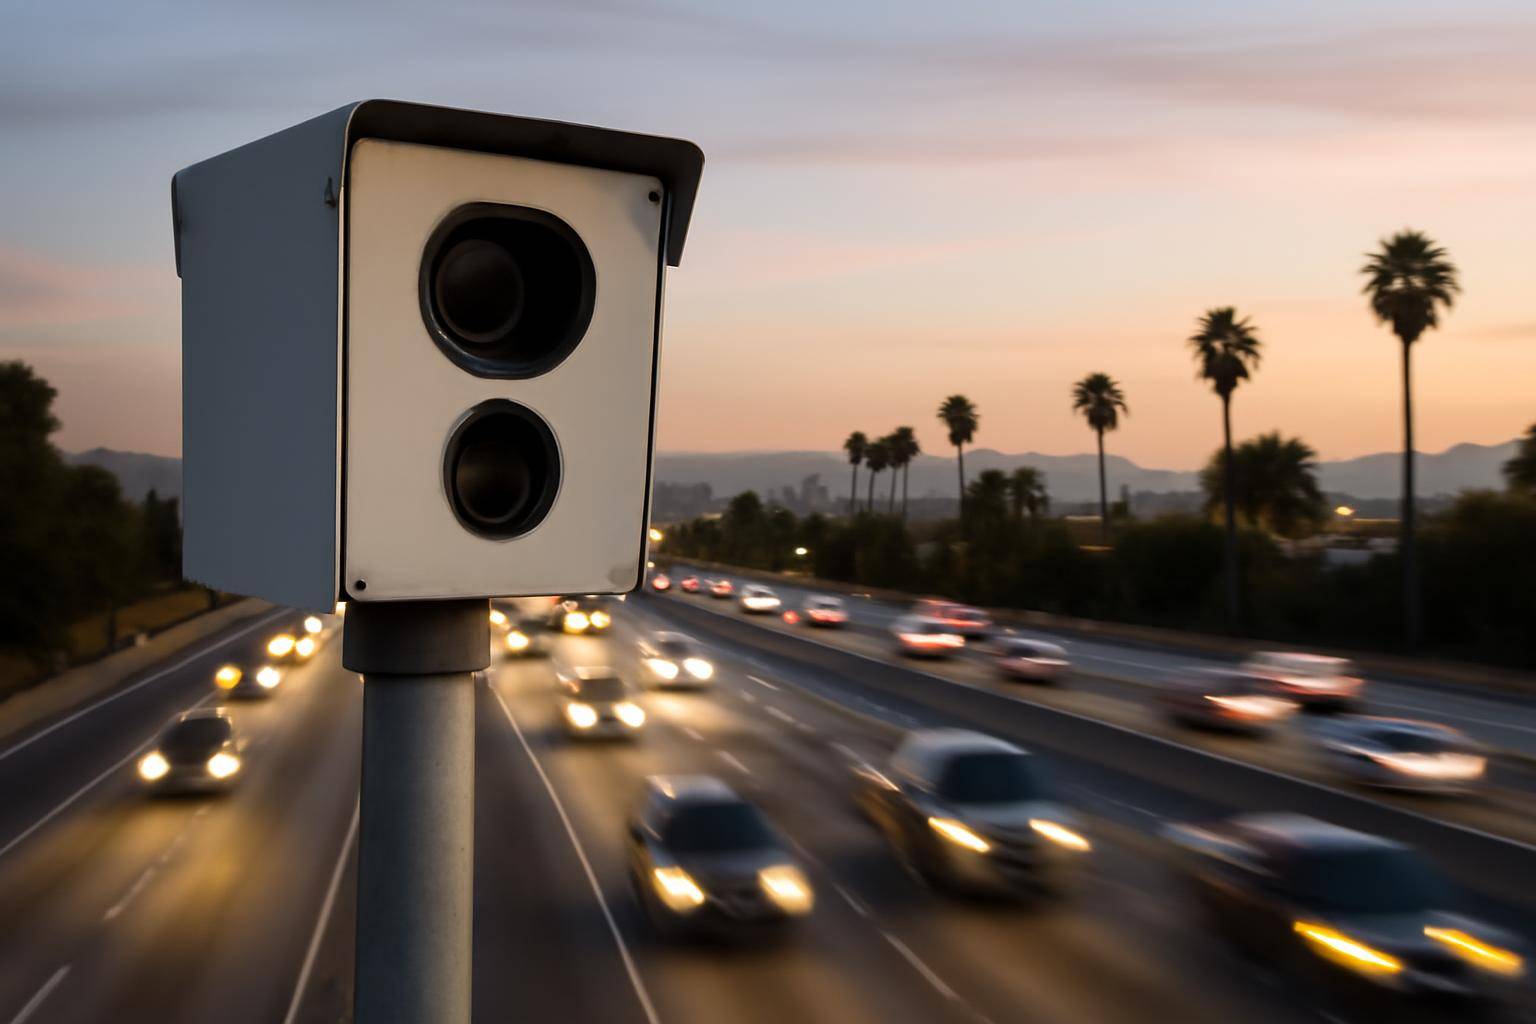
California logged 100,000 speed violations from just four cameras running over ten days, according to The Drive's report on the state's early speed enforcement trial. That ratio — four devices, ten days, six-figure results — is the headline number driving coverage of the program, and it is the figure worth working through if you want to understand what the state is testing and what it might mean for anyone driving through a monitored corridor.
Here is how to read the numbers, how automated speed trials like this one generally run, and what steps a driver can take to find out whether a route is being watched.
What Happened During the Test
The trial placed four fixed units at selected locations and let them run for a ten-day window. Over that span, the units flagged 100,000 violations combined, per The Drive. The outlet frames the result as evidence the small-scale trial is working as intended: catching a high volume of speeding drivers with a minimal footprint of hardware. No per-location breakdown, exact dates, or city names appear in the available reporting, so treat the four-unit, ten-day, 100,000-violation figures as the full extent of what has been confirmed so far.
Why Four Units Produced So Many Flags
A small device count generating a large violation total usually comes down to traffic volume and dwell time rather than anything exotic about the technology. A unit mounted on a busy corridor sees thousands of vehicles pass every day, and even a modest violation rate compounds quickly across that volume. The Drive's reporting treats the 100,000 figure as a sign the locations chosen for the trial see significant speeding activity, which is consistent with how early-stage enforcement tests are usually sited: on roads where officials already suspect a problem, not on random streets.
How Pilot Programs Like This Usually Work
Most automated speed trials follow a similar sequence, and this one appears to fit that pattern based on what has been reported:
- Officials pick a short list of locations, often ones with documented speeding complaints or crash history.
- Units are installed and calibrated, then left to log data for a fixed window — ten days in this case.
- Violations are tallied and reviewed before any citations go out, since a trial period is typically used to validate accuracy and volume before enforcement begins in earnest.
- Results get reported to lawmakers or transportation agencies, who decide whether to expand, adjust, or end the program.
The Drive's piece places California's effort at that data-gathering stage: a short run meant to show whether the concept catches real violations at scale, which 100,000 flags from four units clearly does.
Where the Program Could Expand Next
The source material does not specify additional sites, a rollout timeline, or a budget figure for scaling beyond the initial four units, so any expansion details remain unconfirmed. What is clear from the reporting is that the trial's volume is being used as a talking point for whether a broader deployment makes sense. If you drive through California regularly and want to track this, the most useful step is watching for official updates from the agency running the trial rather than assuming a specific city or highway is next — the current reporting does not name one.
If you are also tracking other local driving-rule changes, a similar pattern — a small test generating outsized attention — shows up in San Diego's new parking restrictions near its tourist corridor, where a narrow rule change produced a wide reaction from drivers.
Can Drivers Contest a Flagged Violation
The available reporting does not detail California's specific appeals process, fine amounts, or whether warnings precede citations during this test window, so we won't guess at those mechanics. What we can say generally: automated enforcement programs almost always include a review step before a violation becomes a citation, and most jurisdictions publish a formal appeals path once a program moves past the trial phase. If this test expands into active enforcement, expect the state to publish those specifics — fine amounts, appeal windows, and signage requirements — separately from the volume numbers reported so far.
For now, the confirmed facts are narrow but notable: four cameras, ten days, 100,000 violations. Anyone driving through California should treat that as a signal that automated speed enforcement is moving from theory to an active test, with more detail likely to follow as officials decide what comes next.
More from the blog
Written by Smorgi Apps at Smorgi Apps. We do not invent download counts or ratings. If a number appears here, it came from App Store Connect or the live listing.